Creating a dashboard
Azure provides the capability of building dashboards and allows you to build some quick insights for your resources:
- Using the charts from the previous exercise, click on the Save to dashboard dropdown and click Pin to dashboard:
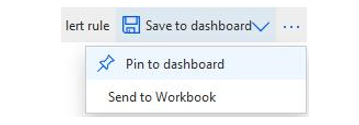
Figure 20.14 – Monitor – Pin to dashboard
2. Since we have not created a dashboard as yet, we will create a new one when saving. Click Create new, enter the following details, and click Create and pin:
- Type: Private
- Dashboard name: MyFirstDashboard
Figure 20.15 – Monitor – Pin to dashboard | Create new
3. Perform the Pin to dashboard action on the second chart, this time selecting Existing and choosing your dashboard from the previous step:
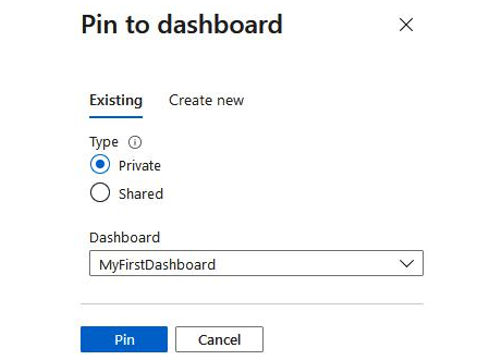
Figure 20.16 – Monitor – Pin to dashboard | Existing
4. Click the hamburger menu in the top left of the Azure portal:

Figure 20.17 – The hamburger menu
5. Click Dashboard from the menu:
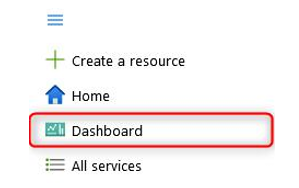
Figure 20.18 – Dashboard
6. Click the dropdown at the top of the screen to select your dashboard, and select the one you created in the previous steps:
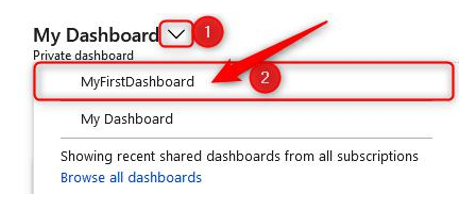
Figure 20.19 – Selecting your dashboard
7. Click Edit at the top of the screen to modify your dashboard view:

Figure 20.20 – Dashboard – Edit
8. Drag the two charts to be next to each other; each of these is called a tile. Note that you can attach several tiles to the dashboard. Once you are happy with the dashboard design, click Save:
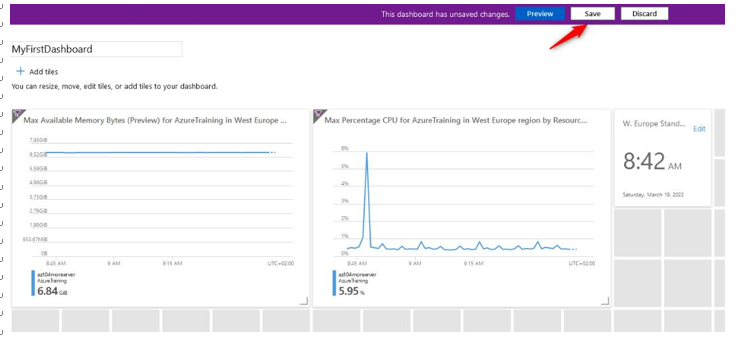
Figure 20.21 – Dashboard – customizing
Top Tip
Metrics are also available directly from the Azure resource blades. So, for instance, if you have a VM, go to the VM resource by selecting it. Then, in the left-hand menu, under Monitoring, you can select Metrics.
You now have your first dashboard set up and configured and have a convenient way to dive into the relevant insights that you need across a resource or several resources and metrics. In the next section, we’re going to look at how to set up and analyze alerts in Azure Monitor.