Creating and analyzing metrics and alerts
There are several ways to consume and analyze alerts and metrics across Azure Monitor. You can consume this directly from the Monitor service as well as from the associated resource blade. In the upcoming sections, we will set up metrics and alerts and show you how to analyze them.
In order to follow along, you will need a resource to monitor metrics from; we will deploy a virtual machine (VM) to assist with this.
Creating a VM
For this exercise, you will be deploying a new VM to monitor against:
- Navigate to the Azure portal by clicking on https://portal.azure.com.
- Create a new resource group named AZ104-Monitor.
- Create a new VM with the following attributes; you can also use the template from Chapter 17, Integrating On-Premises Networks with Azure, and modify the following as well as name the VNet and subnet:
- Subscription: Select your Azure subscription.
- Resource Group: AZ104-Monitor.
- Virtual machine name: MonitorServer.
- Region: West Europe (or select what you prefer).
- Image: Windows Server 2019 Datacenter – Gen 2.
- Size: Standard_DS1_v2.
- Username: packtadmin.
- Password: Select a password you want.
- Public inbound ports: RDP (3389).
- VNet name: monitorvnet.
- Subnet name: monitorsubnet.
Now that your VM is deployed, you can proceed to configure a metric monitor.
Creating a metric
To display the metrics for the various Azure resources in Azure Monitor, perform the following steps:
- In the top search bar for Azure, type Monitor and click Monitor from the options that appear:
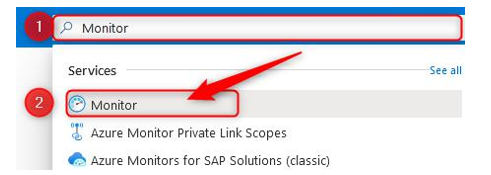
Figure 20.6 – Searching for Monitor
- You will be presented with the following Overview screen:
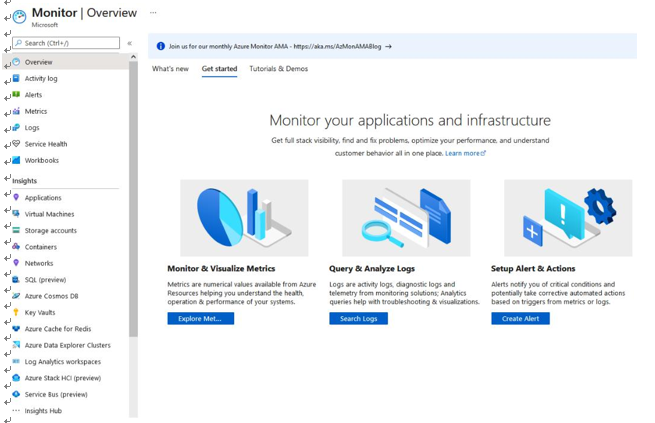
Figure 20.7 – Monitor | Overview
- First, we’re going to look at metrics. Therefore, on the left-hand menu, select Metrics or the Explore Metrics button from the Overview blade.
- You will be prompted to select a scope; select your Subscription, Resource group, Resource type, and Location preferences, and click Apply. If you are following along, your details will be as follows:
- Subscription: Select your Azure subscription.
- Resource Group: AZ104-Monitor.
- Resource type: Virtual machines.
- Region: West Europe (or select what you prefer).
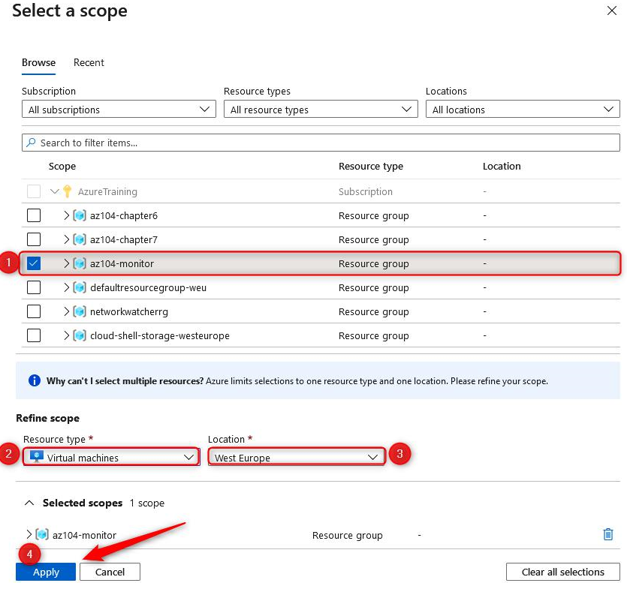
Figure 20.8 – Monitor – scope
- On the Scope bar at the top of the screen, select Percentage CPU from the Metric dropdown and Max from the Aggregation dropdown:

Figure 20.9 – Monitor – selecting Metric and Aggregation
- Since your VM hasn’t been running for that long, we will change the time period that the chart is displaying for. Click the time bar in the top right of your Metrics blade and select Last hour from the Time range options, and then click Apply:
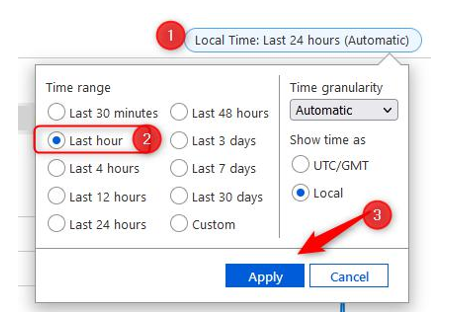
Figure 20.10 – Monitor – Changing the time period
- Note how you can see your maximum CPU percentage usage over time. As a point of interest, you can load several charts to a single monitor page for instance, monitoring Available Memory Bytes on your VM:
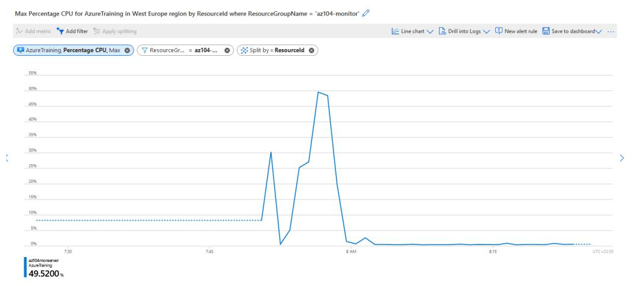
Figure 20.11 – Monitor – CPU usage over time
- Let’s look at adding another chart; click + New chart at the top of the screen:

Figure 20.12 – New chart
- Set the scope to be the same as before.
- Azure monitors the available memory as opposed to memory usage, which can be calculated in reverse as total memory – available memory. The measure is more apt, as you can determine what percentage of memory is left before you trigger an alert that something is wrong on your VM, for instance. Select Available Memory Bytes from the Metric dropdown and Max from the Aggregation dropdown:
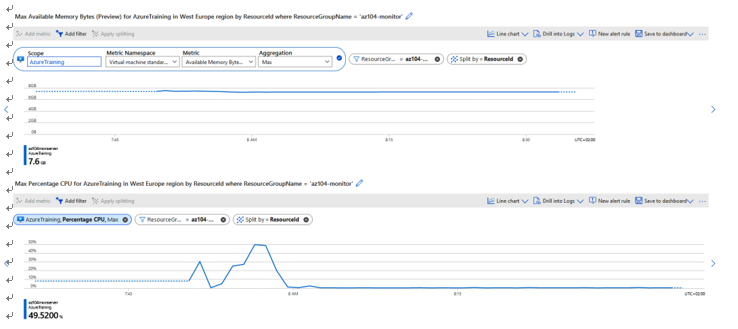
Figure 20.13 – Monitor – CPU usage over time
Top Tip
Take some time to look at the different metrics that you can choose from. This may be a part of the exam questions.
You have now experienced working with metrics and adding ones to different charts for monitoring in Azure. Next, we will create a dashboard with these charts. Keep your metrics screen open from this exercise from which to continue for the next exercise.