Diagnostic settings
You can also configure diagnostic settings on different Azure resources. There are two types of diagnostic logs available in Azure Monitor:
- Tenant logs: These logs consist of all the tenant-level services that exist outside of an Azure subscription. An example of this is the Azure Active Directory logs.
- Resource logs: These logs consist of all the data from resources that are deployed inside an Azure subscription – for example, virtual machines, storage accounts, and network security groups.
The contents of these logs are different for every Azure resource. These logs differ from guest OS-level diagnostic logs. To collect OS-level logs, an agent needs to be installed on the virtual machine. The diagnostic logs don’t require an agent to be installed; they can be accessed directly from the Azure portal.
The logs that can be accessed are stored inside a storage account and can be used for auditing or manual inspection purposes. You can specify the retention time in days by using the resource diagnostic settings. You can also stream the logs to event hubs to analyze them in PowerBI or insert them into a third-party service. These logs can also be analyzed with Azure Monitor, which doesn’t require the logs to be stored in a storage account first. Azure Monitor provides the capability to address your log data based on a time period, which enables quick insights into historical and near real-time data views.
Now that we have some basic knowledge about Azure Monitor, we are going to look at the different areas where you can analyze data, alerts, and metrics across subscriptions.
Service Health
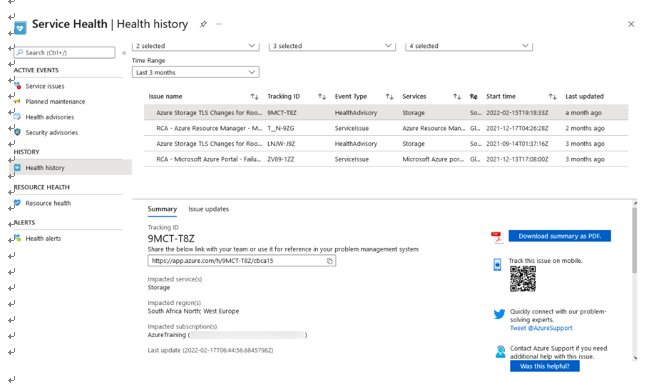
Service Health displays the Azure platform service health statistics; if there are currently any issues that are affecting your resources within your tenant, they will be reflected here. This space also contains service health history, as shown in the following screenshot:

Figure 20.5 – Service Health
Note that there are different types of events highlighted for each entry, and the screenshot also identifies the status and services that are affected. Clicking an entry gives some details about the issue, as well as creating a downloadable PDF format in the bottom-right corner for a full description of each issue per entry.
Note that on the left pane underACTIVE EVENTS, there are several categories:
- Service issues: This section notifies you of issues on the Azure platform that you need to be aware of and that may be impacting expected service delivery from the platform.
- Planned maintenance: This refers to platform maintenance that is planned and expected to be carried out; it will highlight the affected services as well as the planned work involved. All planned maintenance will contain dates so that your team can plan for outages and disruptions in services.
- Health advisories: All platform-related health advisories will appear here.
- Security advisories: Platform-related security advisories will show up here; note that these are not resource-related notifications but rather platform-related ones.
Next, we will explore the creation of metrics and alerts within Monitor.