Effective security rules
This is usedto determine the overall effective security rules applied to your VM and will combine all relevant NSG rules together to display the net rule effect. This can be extremely helpful when assessing why your traffic is blocked and where you have several NSGs.
VPN troubleshoot
This isused when there are issues between your VNet gateways and connection endpoints that require troubleshooting. Multiple gateways and connections can be troubleshot at the same time.
Packet capture
The packet capture feature in Network Watcher allows you to capture packets for traffic related to your VM, being both inbound and outbound from the VM. The capture enables you to have more visibility of your network traffic, garnering key insights such as intrusion detection traffic, network statistics, and other network-related communications and traffic. This is enabled as a VM extension and relieves you of running your own VM-hosted packet capture utilities to achieve the same results.
Connection troubleshoot
This toolenables you to assess TCP connections between a VM and either a VM, URI, IPv4 address, or even FQDN. The aim of the tool is to reduce the time required in identifying connectivity issues and assist with determining the root cause.
Metrics
The Metrics category primarily contains usage and quota data as per the following category:

Figure 18.4 – Network Watcher, Metrics
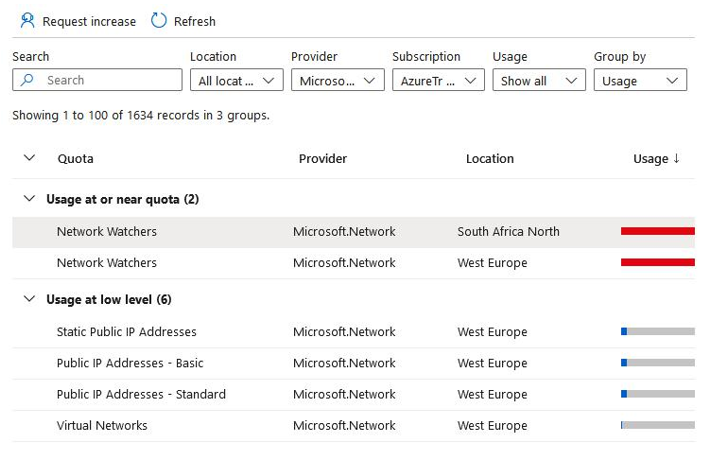
Usage + quotas
This paneprovides an easy mechanism to gain visibility of your usage against each quota, as well as providing the ability to request a quota increase for additional consumption of services:

Figure 18.5 – Network Watcher, Usage + quotas
Next, we will explore what logs are and the types of logs we can collect.
Logs
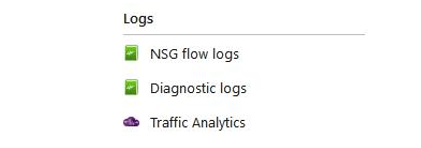
Logs provide several logging tools that are useful for investigating usage and troubleshooting. These logs can be analyzed using several tools, such as the Traffic Analytics feature and Power BI:

Figure 18.6 – Network Watcher, Logs
Next, we will explore the various log types found in the service.
NSG flow logs
NSGs are responsible for allowing or denying the inbound and outbound traffic to a network interface in the VM. The NSG flow logs feature can log the port, protocol, whether traffic is allowed or denied, and the source and IP address. The NSG flow logs feature is where you configure the logging of your flows.
Diagnostic logs
This paneallows you to configure the diagnostic logging settings for your resources; it will record NSG events and rule counts as NetworkSecurityGroupEvent and NetworkSecurityGroupRuleCounter. The logs can be stored in a variety of locations such as Log Analytics, Event Hubs, or an Azure storage account.
Traffic Analytics
Traffic Analytics can provide rich visualization of the data that is written to the NSG flow logs.
Top Tip
Network Watcher is a regional service, which means that you need to deploy it for each region that you require the service.
In the sections that follow, we are going to see Network Watcher in action.