Enabling Network Watcher
To enable Network Watcher in a specific region, take the following steps:
- Navigate to the Azure portal by opening https://portal.azure.com/.
- Click the hamburger menu in the top-left corner of the Azure home screen. Select All services:
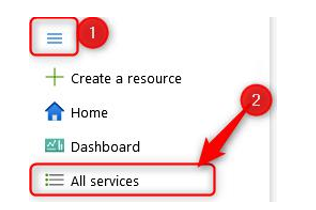
Figure 18.9 – Selecting All Services
- Type network watcher in the search bar, then click Network Watcher:
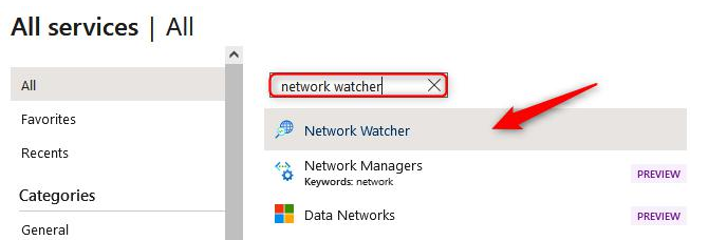
Figure 18.10 – Selecting network watcher
- On the Network Watcher Overview page, select the Network Watcher service with the Subscription and Location details that match the VM you deployed earlier. In my case, this is West Europe:

Figure 18.11 – Selecting your Network Watcher
Top Tip
Note that upon deploying your first VNet in an Azure region, Azure will automatically create the associated NetworkWatcher_ resource.
- If Network Watcher is not already deployed for your region, click + Add at the top of the screen. Select Subscription and Region and click Add:
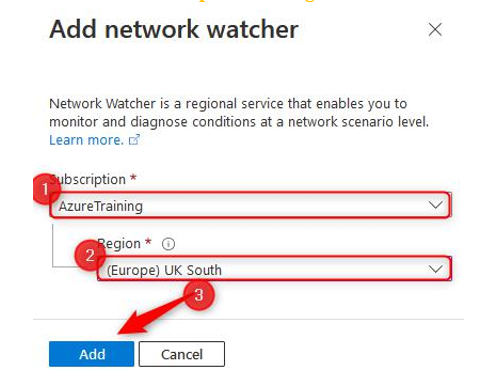
Figure 18.12 – Enabling a new Network Watcher region
Now that Network Watcher is enabled, we can actually start monitoring the network resources.
Monitoring network connectivity
Network monitoring can be used for monitoring connection reachability, latency, and network topology changes. To do this, you need to set up a Connection Monitor instance.
Take the following steps to set this up:
- With the Network Watcher resource still open, in the left menu underMonitoring, select Connection monitor. Click + Create.
- We are going to use the monitor resource for testing the connectivity between VM1 and VM2. Therefore, enter the following values and click Next: Test groups >>:
- Connection Monitor Name: VM1-VM2-Test.
- Subscription: Select the subscription where the VMs are deployed.
- Region: Select the region you chose for your VMs.
- Workspace configuration: Leave the default option checked (this will create a new workspace for you):
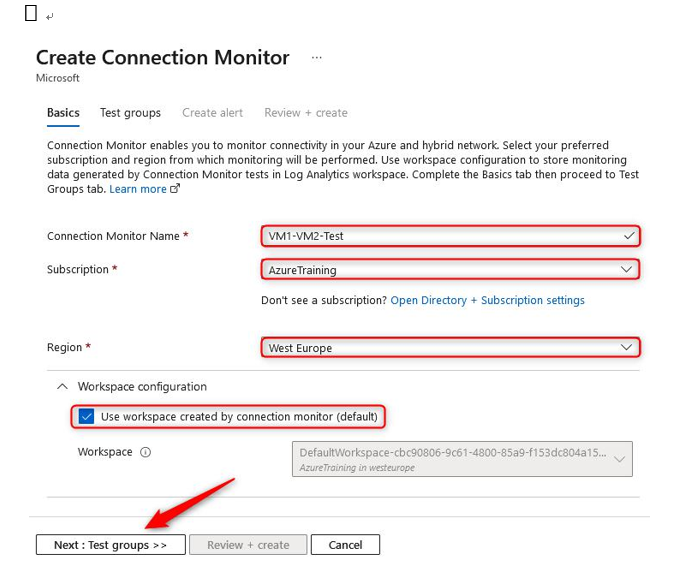
Figure 18.13 – Create Connection Monitor, Basics
- Type VM1-VM2-Test in Test group name and click Add sources:
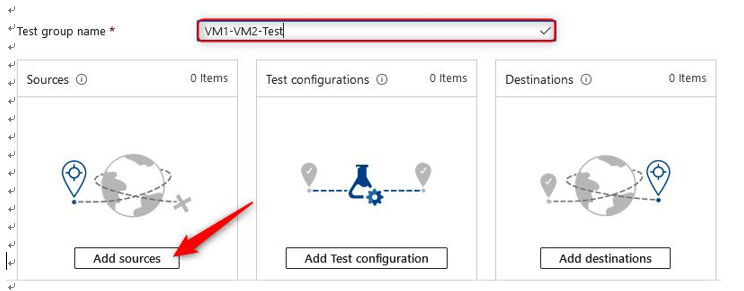
Figure 18.14 – Create Connection Monitor, Add sources
- On the Add Sources blade, select your networkwatcher1 VM, then click Add endpoints at the bottom of the screen:
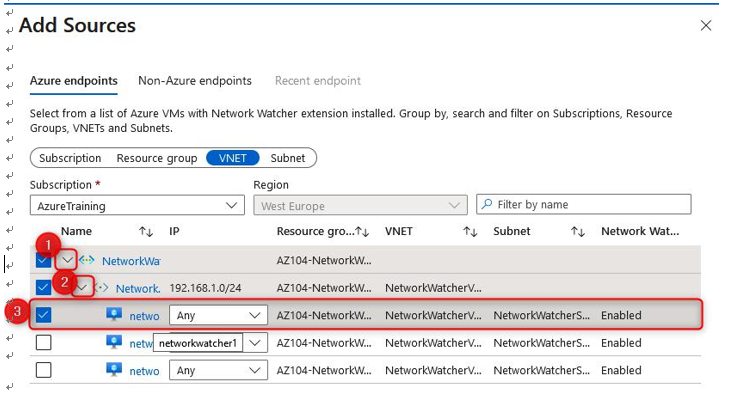
Figure 18.15 – Adding a Connection Monitor source
- Perform the same for Click Add endpoints Add destinations, this time selecting networkwatcher2. at the bottom of the screen:
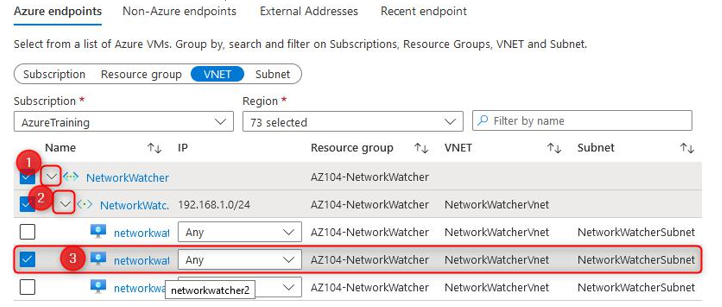
Figure 18.16 – Adding a Connection Monitor destination
- Click Add Test configuration, then enter the following into the blade. Click the Add Test configuration button at the bottom when done:
- Test configuration name: VM1-VM2-Test-Config.
- Protocol: TCP.
- Destination Port: 3389.
- Check the Listen on port checkbox.
- Test Frequency: Every 30 seconds.
- Checks failed (%): 5.
- Round trip time (ms): 100.
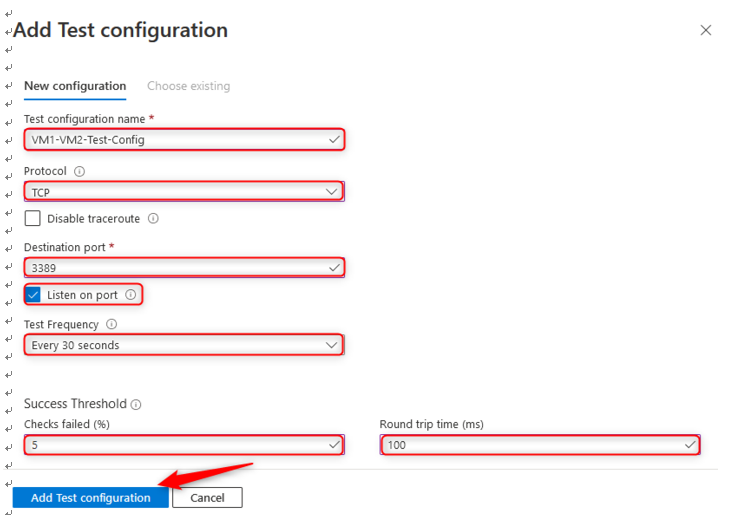
Figure 18.17 – Connection Monitor settings
- Click Add Test Group.
- Click Next: Create alert >>.
- Note that you can create an alert by clicking the Create alert checkbox at the top of the screen. Click Select action group near the bottom of the page. You can create an action group by entering your email address and clicking Create action group, or by selecting an existing one. Click Done.
- Click Review + Create, then click Create.
- You will notice after a few minutes that the connection is good and gets a pass:

Figure 18.18 – Connection Monitor Overview
We are now able to monitor the network connectivity. In the next section, we are going to look at how to manage the connectivity.