Network diagnostic tools
There are several network diagnostic tools presented to you in Network Watcher. You can, for instance, diagnose network traffic filteringfor VMs, determine the next hop of your traffic on route to an intended destination, or even identify why a VM is unable to communicate with other resources because of a security rule.
Using Azure Network Watcher, you can diagnose outbound connections from a VM. You can also diagnose problems with an Azure VNet gateway and connections, capture packets to and from a VM, view security rules for a network interface, and determine relative latencies between Azure regions and internet service providers.
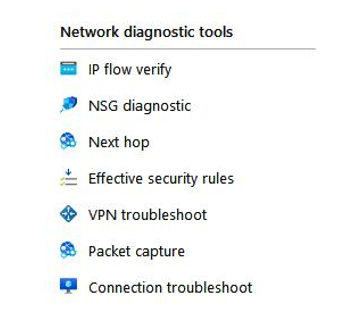
The following tools are available as presented in the following screenshot:

Figure 18.2 – Network Watcher, network diagnostic tools
Let’s look at them in more detail.
IP flow verify
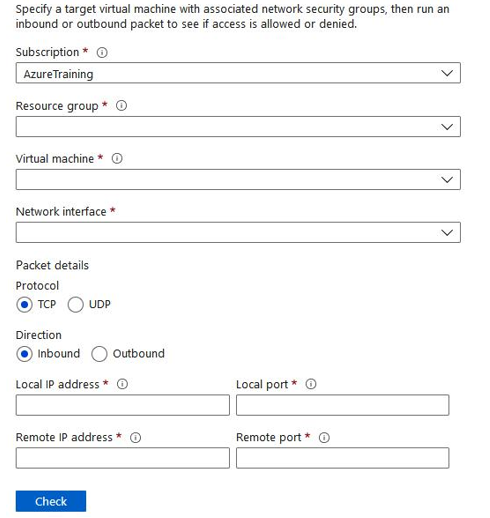
An IP flow can verify and test the communication and inform you as to whether the connection has succeeded or failed. It is used to assess traffic flow to and from the internet and on-premises environments. An IP flow can tell you which security rule allowed or denied the connection and communication. To use IP flow verify, you specify a source (local) and destination (remote) IPv4 address and port. Along with this, you enter the corresponding packet information such as your protocol transmission control protocol /
user datagram protocol (TCP/UDP) and direction of traffic flowInbound(/Outbound):

Figure 18.3 – Network Watcher, IP flow verify
NSG diagnostic
This toolenables you to identify the net effect of applied network security group (NSG) rules that apply as well as identify all NSGs that will be used. The output will expose the end result allow and deny status for the identified flow. To run NSG diagnostic, you again specify your source and destination. The source can be an IPv4 address or a Classless Inter-Domain Routing (CIDR) range, or it can be a service tag, whereas the destinationspecified is an IP address only. You also choose your port for the destination, specify your traffic protocol (TCP/UDP/ Internet Control Message Protocol (ICMP)/All) and direction. The diagnostic supports VMs, network interfaces, VM scale set network interfaces, and application gateways.
Next hop Network Watcher can also diagnose network routing problems from a VM. When a VNet is created, there are several default outbound routes created for that VNet as well. Outbound traffic from all resources that are deployed in a VNet is routed based on Azure’s default routes. In cases where you want to override the default routing rules or create additional rules, Next hop can be used to test the communication between the different routes. When the communication fails, you can then change, add, or remove a route to resolve the problem.