Querying logs in Azure Monitor
To query logs in Azure Monitor, perform the following steps:
- Navigate to the Azure portal by opening https://portal.azure.com.
- In the top search bar for Azure, type Monitor and click Monitor from the options that appear. You will be directed to the Overview pane.
- From the left menu, selectLogs.
- You may be presented with a tutorial popup screen, which you can close, or you can consume the content as you desire. All subsequent logins will present a query screen, allowing you to quickly perform common queries easily.
- For this demo, we will use an environment Microsoft created to allow you to query data in a prepopulated system.
- Navigate to https://portal.azure.com/#blade/Microsoft_Azure_ Monitoring_Logs/DemoLogsBlade, which is similar to your logs query space from step 4.
- Note that the middle contains a screen that you can type in – this is where you create your queries, the bottom of which is the results area where your query results and graphics will be displayed. On the left pane, note several collapsed data menus; these represent data sources that can be queried from Log Analytics:
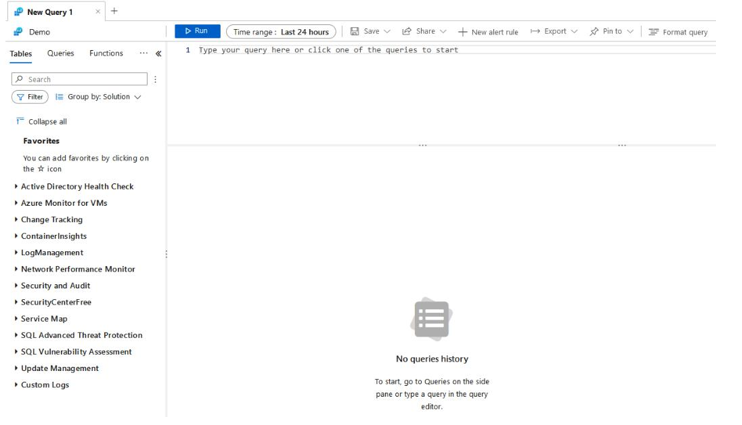
Figure 20.33 – The Log Analytics workspace – query
- Select a data source – in this example, we will use Azure Monitor for VMs; click on this heading to open the underlying data source collections. Click on InsightsMetrics and then Use in editor:
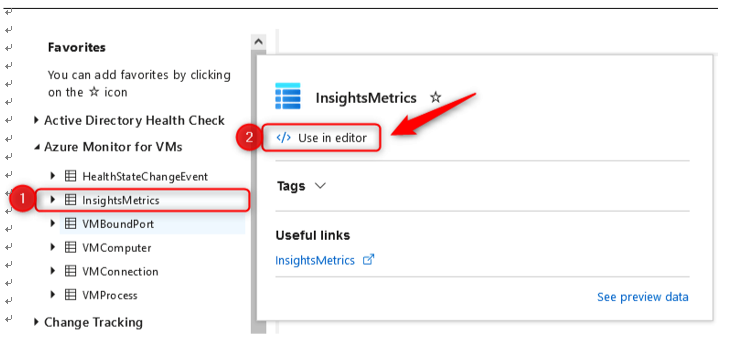
Figure 20.34 – The Log Analytics workspace – data source collections
- Note that on your query pane, it has initiated a query that is labeled as your data source collection. For future queries, you can type the data source collection as opposed to selecting in this fashion.
- Click the Run button to generate results that are stored in that table. Note that the data has headings that you can explore as you scroll through the results section. Some of the headings (columns) may be hidden from the result view:
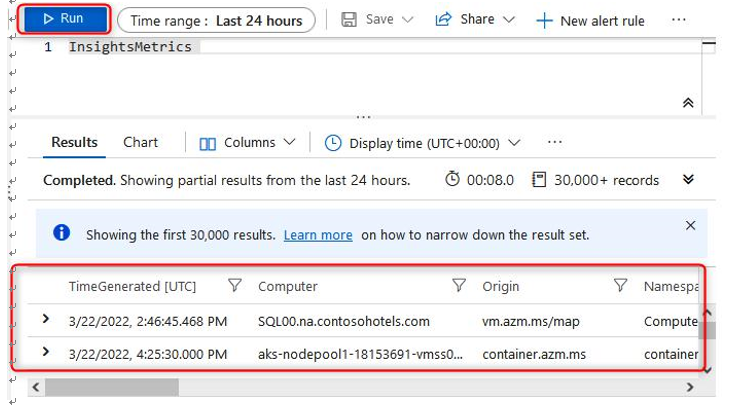
Figure 20.35 – The Log Analytics workspace – an example query
- Open the collection source on the left pane to see the various data types associated with each row along with their heading name:
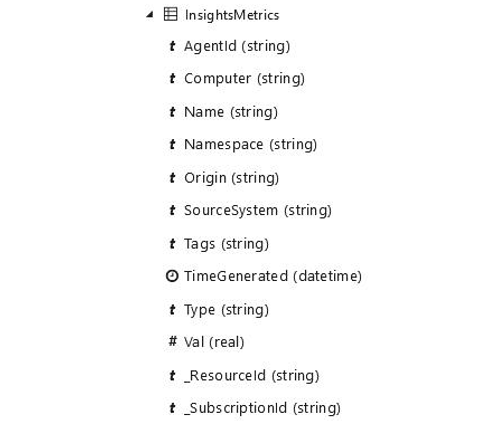
Figure 20.36 – The Log Analytics workspace – column types
- Now that you know the headings, you may want to filter your data further and start to extract some relevant information – for instance, you can return an aggregated table with the computer(s) associated with the record(s) in your table by running the following command:
InsightsMetrics | summarize by Computer
The result of the command will be output similar to what is displayed in the following screenshot:
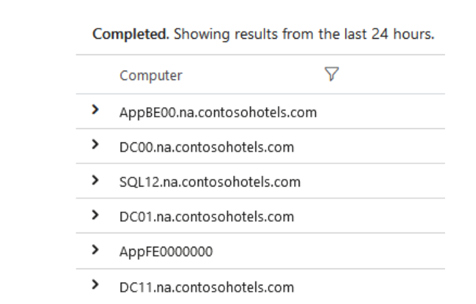
Figure 20.37 – The Log Analytics workspace – a summarize example
- You can add a second column by modifying the query accordingly; this time, you will expect to see a computer name several times, as the unique returned value is a combination of the computer and the TimeGenerated column:
InsightsMetrics | summarize by Computer, TimeGenerated
- Let’s try a different query, such as the following, which will show the count of each type of alert detected:
Alert | summarize count() by AlertName
This will produce output similar to the following:
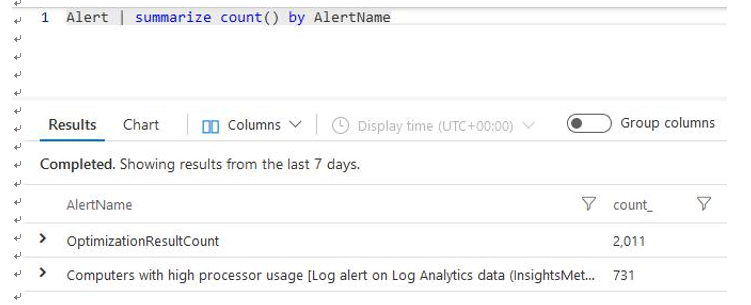
Figure 20.38 – The Log Analytics workspace – a summarize count example
- Your default time range is 24 hours, as specified at the top of your query window next to the Run button. You can manually modify this by clicking the button and choosing an appropriate time range to query for, or you can modify your query directly:

Figure 20.39 – The Log Analytics workspace – time range
- Let’s modify the query:
Alert | where TimeGenerated > ago(2d) | summarize count() by AlertName
- You may want to visually understand this information and choose to display this in a bar chart – for example, if you were reporting on the count of each alert type you noticed in a week. You can do this with the following command:
Alert | where TimeGenerated > ago(7d) | summarize count() by AlertName | render barchart
This will produce a visual output, defined as a bar chart, similar to the following:
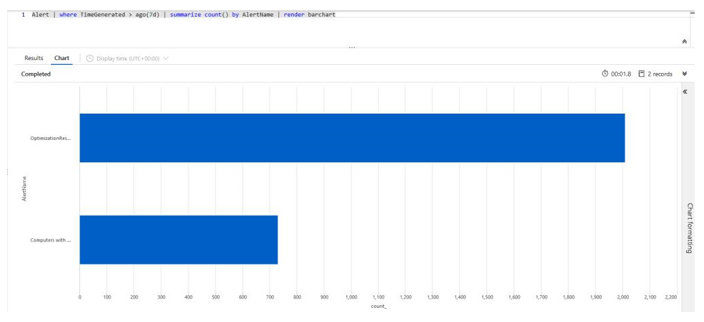
Figure 20.40 – The Log Analytics workspace – a bar chart example
- You have many lines of data that can become difficult to sift and read through, so you may want to aggregate your results into something discernable, such as grouping results into predefined periods of time. We call this aggregating into buckets/bins. Modify the query accordingly to see the alert data collected into 1-day buckets, showing the number of alerts received per day for the last 7 days:
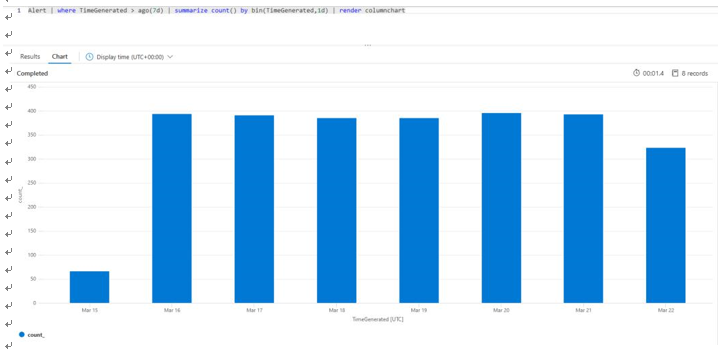
Figure 20.41 – The Log Analytics workspace – a binning example
You have just experienced some basic queries that you can perform in Log Analytics and can now understand the power behind what you can achieve using these queries. Remember that the result of these queries can be visualizations, notifications, and even automated actions as a result of data. You are encouraged to practice and learn more about this resource not just for the exam but also to enhance the way you deliver in your role for your organization and customers. You have now gained some valuable skills in navigating the basics of Log Analytics and should feel comfortable in understanding what a query is intended to do and predicting the outcome of queries, as well as being capable of building your own.
For some more examples, you can explore this URL: https://docs.
microsoft.com/en-us/azure/data-explorer/kusto/query/ samples?pivots=azuredataexplorer.
Top Tip
A detailed overview and tutorial on how to get started with KQL are beyond the scope of this book. If you want to find out more about this language, you
can refer to https://docs.microsoft.com/en-us/azure/ data-explorer/kusto/query.
Next, we will explore the configuration of Application Insights.